While TikTok might be all fun and games for users, marketers know better.
This social media channel is full of essential metrics to help brands create more engaging and relevant content for their audiences, so let’s get right to it: TikTok analytics.
Read below to learn what you’re looking for on TikTok’s analytics platform, how to interpret the data you find, and how to use that data to grow your brand’s presence.
Accessing Your TikTok Analytics
The first thing to know is that you must have a business or an influencer account to access TikTok analytics rather than a standard account.
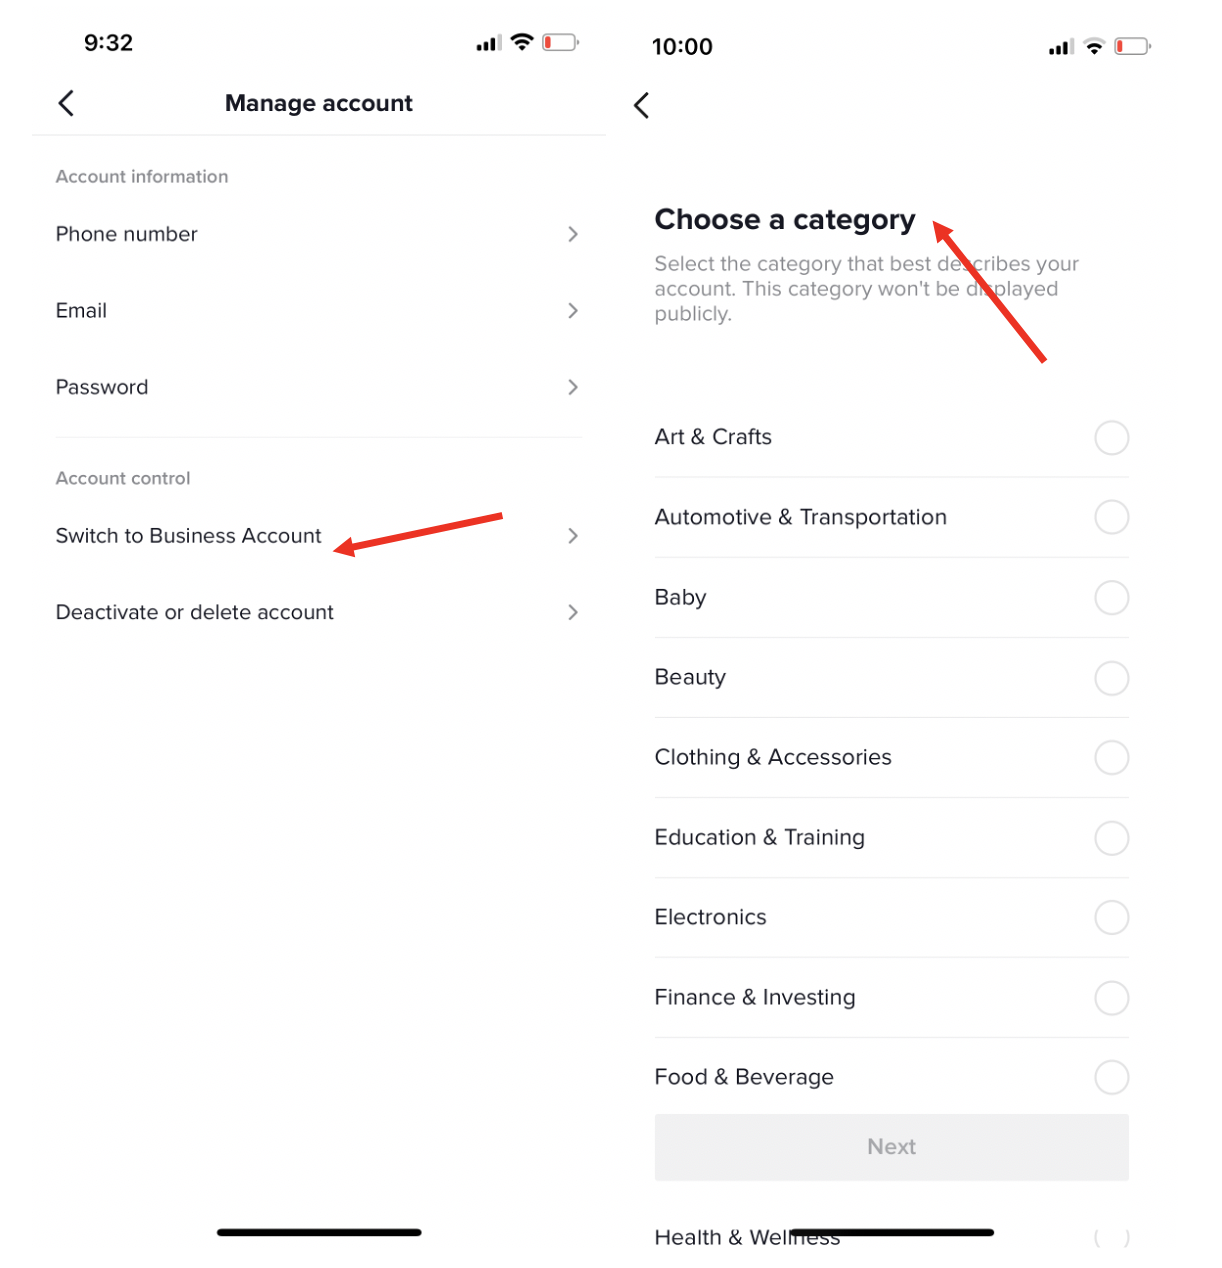
Make the switch to a professional account by:
Tap the Hamburger icon (upper-right)> Settings & Privacy > Manage Account > Switch to a Business Account > Select your business category.

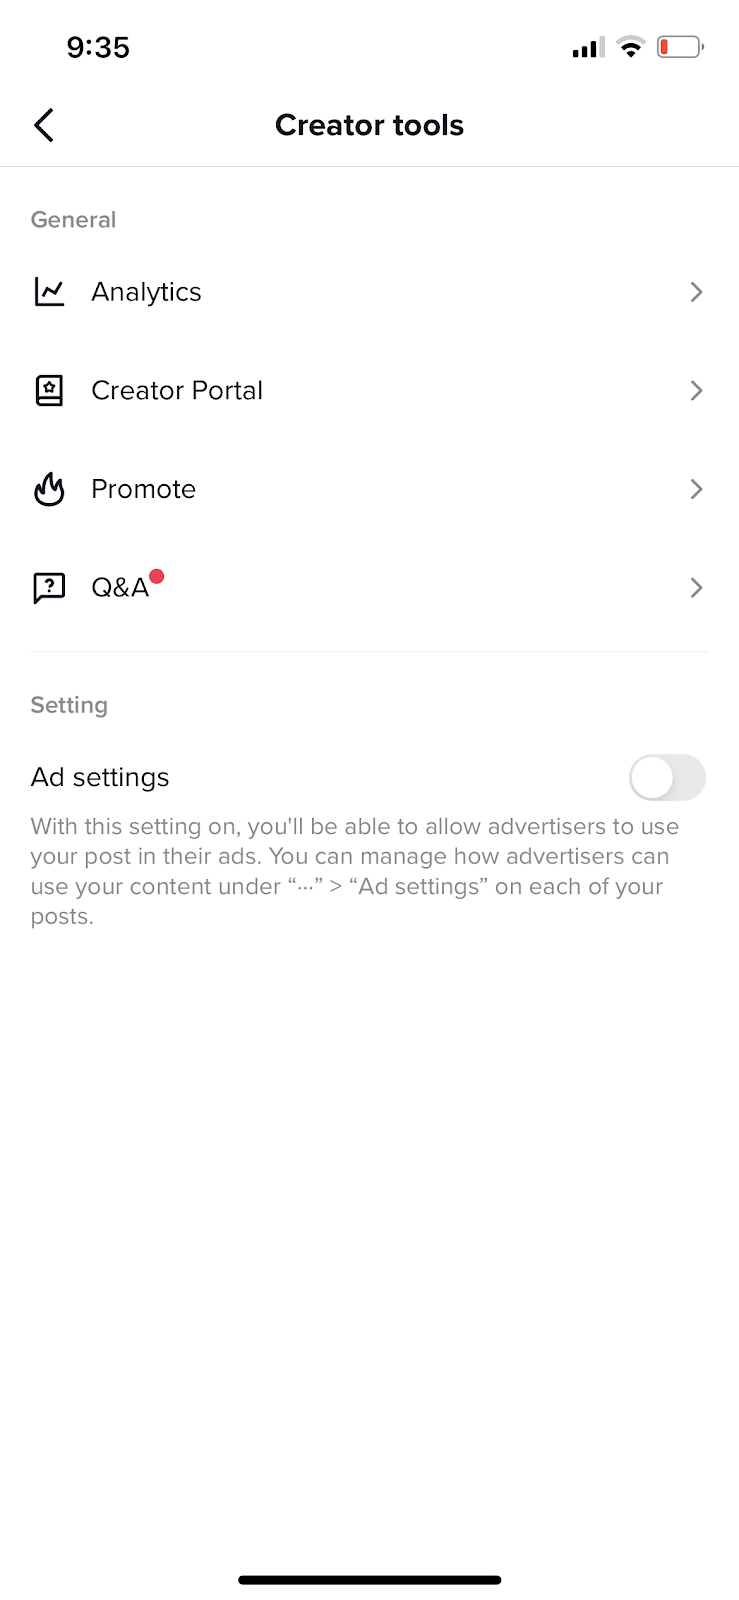
Once you’re set, you can navigate to your analytics by:
Tap the Hamburger (upper-right) > Click Creator Tools > Click Analytics.
 Screenshot from TikTok, September 2022
Reviewing TikTok Analytics Data
When you navigate your analytics page, you will see three different categories at the top of your screen that you can click into for more data: Overview, Content, and Followers.
Overview
Like other social analytics platforms, TikTok offers a snapshot of how your content has been performing over a select period and the % increase or decrease since the previous period (shown in blue).
This data includes two significant aspects of your channel:
- Video views: Shown in a graphical format, you can easily pick out trends over the last month on your channel regarding how many people watched your videos.
- Profile views: Here, you will see the number of likes, comments, and shares for each video you’ve posted over a given period.
Additional metrics offered under the Overview tab include:
- Likes: The number of likes your videos received in the selected date range.
- Comments: The number of comments your videos received in the selected date range.
- Shares: The number of shares your videos received in the selected date range.
- Followers: The total number of users that follow your account and how that has changed within the selected date range.
- Content: The number of videos you have shared in the selected date range.
Followers
When you scroll down on that same overview page, you’ll next see that you can click into your “followers” analytics (also found as a tab at the top of your screen, as shown above).
Here you’ll be able to see:
- How many followers your account has.
- Your follower growth percentage since the previous period you selected.
- Demographic information about your followers, such as gender and location.
- The hours your followers are most active.
- The days your followers are most active.
- The sounds your followers have listened to.
Although the actual analytics page might not look like much, we consider this the essential metric TikTok offers (more on this later).
Content
Your analytics page’s “content” tab is a great way to see which content you post is getting the most attention.
You will see this tab broken up into several subsections showing data from the last seven days, including:
- Video posts: Here, you can see the last nine videos you posted and determine which video had the highest number of views.
- Trending videos: The videos with the fastest growth rate in views over the last week are presented here.
- Video views by section: Here, you can see if people found your video via your profile, someone else’s profile, or if you appeared in their feed.
- Video views by region: This helps you understand where your content is resonating geographically.
- Average watch time: We love this metric because it helps show you what’s engaging!
- Total playtime: Unlike average watch time per video, your total playtime shows you a cumulative watch time for anyone who has watched your videos.
Note: If you have more than 1,000 TikTok followers, you are eligible to host Live TikTok videos. With Live videos comes another analytics page for you to see precisely how your live video performed. Learn how to get started with a live TikTok video here.
Extra: Total Engagement Rates
SocialChamp offers a little hack to help you get another metric that could be useful: total engagement rates.
Just follow one of the below formulas to calculate this number:
 Image from author, September 2022
Monitoring TikTok Hashtags
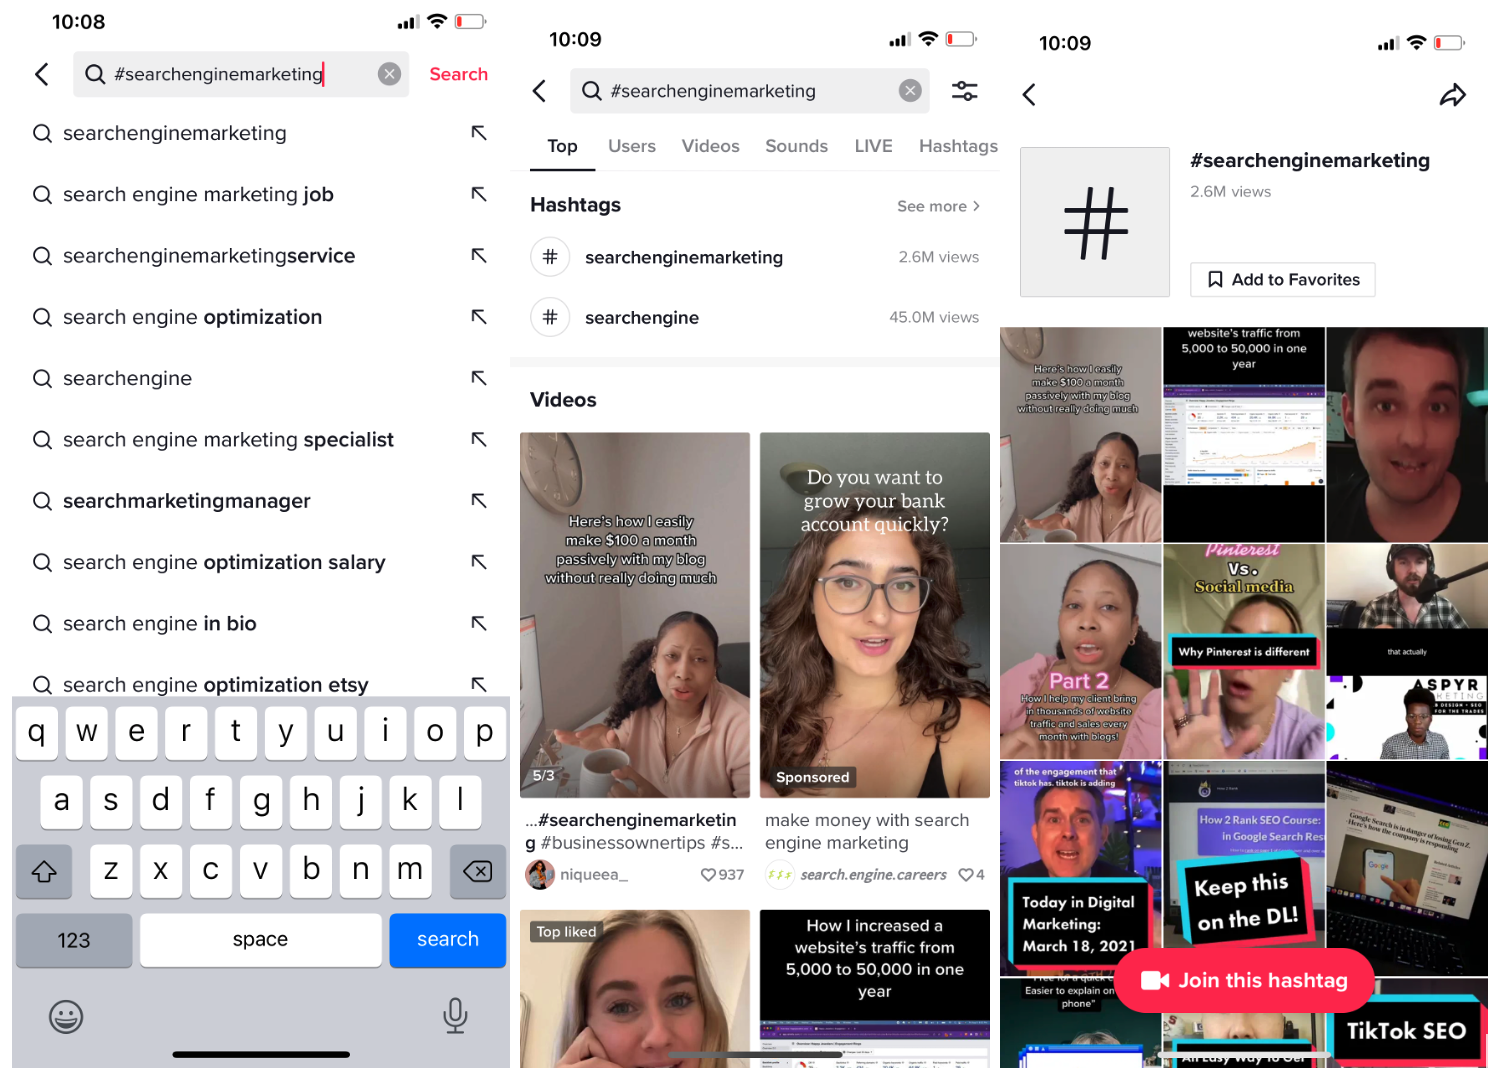
Metrics surrounding hashtags aren’t found in the same place as the metrics discussed above. However, it’s still worth analyzing different hashtags in your niche and seeing the number of times a post with a particular hashtag has been viewed.
To find this data, use the Search bar to find a hashtag.
Here, you’ll be able to see the number of views that hashtag has, the top videos that use the hashtag, and related hashtags.
 Composite image: screenshots from TikTok, collage by author, September 2022
Using TikTok Analytics To Grow Your Channel
Each section of TikTok analytics provides you with the valuable insight needed to grow your page and influence the right audience. Here are the three main takeaways:
Know The Ideal Times To Post Content
This is low-hanging fruit. See when (the day and time) your followers are engaging on the platform, and that’s when you should aim to post.
Understand The Videos That People Like The Best
Look at which videos people engage with the most through likes, comments, and watch time.
If you find that your funny videos outperform your informative ones, you know what to do!
These metrics should help guide your content creation strategy.
Discover What Is Working With Your Audience Beyond Your Page
Look at the analytics for popular sounds your audience likes and what hashtags they are using, and start incorporating these into your future videos.
Final Thoughts
Love it or hate it, TikTok isn’t going anywhere anytime soon.
Even if your audience isn’t on TikTok yet, we suspect more and more will adopt this platform, just as they eventually did with Instagram.
So, getting a head start on understanding how it works and creating a channel that resonates with and engages your target audience is best. (Remember, you can always repurpose your TikTok content for platforms like Instagram and Facebook!).
Happy analyzing!
More resources:
Featured Image: Petryshak/Shutterstock
window.addEventListener( ‘load’, function() {
setTimeout(function(){ striggerEvent( ‘load2’ ); }, 2000);
});
window.addEventListener( ‘load2’, function() {
if( sopp != ‘yes’ && addtl_consent != ‘1~’ && !ss_u ){
!function(f,b,e,v,n,t,s)
{if(f.fbq)return;n=f.fbq=function(){n.callMethod?
n.callMethod.apply(n,arguments):n.queue.push(arguments)};
if(!f._fbq)f._fbq=n;n.push=n;n.loaded=!0;n.version=’2.0′;
n.queue=[];t=b.createElement(e);t.async=!0;
t.src=v;s=b.getElementsByTagName(e)[0];
s.parentNode.insertBefore(t,s)}(window,document,’script’,
‘https://connect.facebook.net/en_US/fbevents.js’);
if( typeof sopp !== “undefined” && sopp === ‘yes’ ){
fbq(‘dataProcessingOptions’, [‘LDU’], 1, 1000);
}else{
fbq(‘dataProcessingOptions’, []);
}
fbq(‘init’, ‘1321385257908563’);
fbq(‘track’, ‘PageView’);
fbq(‘trackSingle’, ‘1321385257908563’, ‘ViewContent’, {
content_name: ‘marketers-guide-tiktok-analytics’,
content_category: ‘social tiktok’
});
}
});


