One area many agencies lack overall, especially in local SEO, is reporting.
Unlike enterprise and international businesses with C-level executives and shareholders, many local businesses only care about getting more foot traffic in their doors.
So by simplifying our approach and focusing on reporting only highly relevant data, agencies can better serve local businesses and build stronger relationships.
Here are seven tips to improve your local SEO reporting and serve your local clients.
1. Simplify Reports
Simplifying your SEO reports is not just a tip that local SEO agencies should follow – but one that generally any agency should, too.
Our first impulse as marketers and communicators is to provide as detailed a report as possible. That’s even more true when marketers need to bury bad campaign results under a mountain of information.
However, our reports should tell a clear and concise story about how well our marketing campaigns perform.
Complicated reports with unnecessary data distract from campaign success and will make some eyes gloss over reading them.
Follow these tips to keep local SEO reports simple and easily digestible for clients:
- Set clear goals: Outline the campaigns’ goals at the top of reports and cite the most relevant metrics in communicating your progress toward those goals.
- Eliminate unnecessary metrics: For the SEO neophyte, metrics like total keyword volume, impressions, and backlinks matter very little if they aren’t driving foot traffic to the store.
- Use a single reporting period: Regardless of how many tools you use, you should stick to tracking one reporting period (e.g., the past 30 days or two weeks) based on when reports are distributed.
- Visualize data: Tools like Semrush provide pie charts and line charts for important keyword metrics that can help clients visualize campaign progress. Google Analytics also provides visuals for metrics, such as new or returning users.
- Segment reports into different sections: Don’t just skip from user metrics directly into social media metrics without clearly separating reports into sections. For example, I like to organize my reports into chapters, such as “Traffic Overview,” “Local Keyword Overview,” “Social Media Overview,” etc.
- Tell a story: Don’t just inundate clients with metric after metric. Instead, explain metrics in brief paragraphs on top of or below charts. I sometimes include a brief one-page SEO primer at the beginning of reports and audits to help people understand what value we’re adding.
2. Choose The Right Metrics
Part of telling a story with data is selecting the correct data that’s relevant to that story.
Most local businesses only really care about two vital metrics:
However, this doesn’t mean you should disregard every important metric, but that you should choose metrics that are relevant to your story.
Even metrics like overall traffic don’t show you how qualified that traffic is or what channels that traffic originates from.
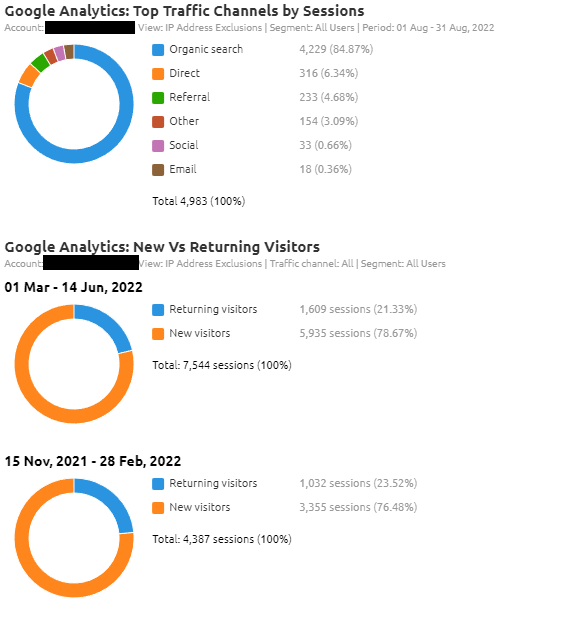
That’s why I like to include the following vital metrics from Google Analytics:
- Top Landing Pages.
- Location by city (Users, New Users, Sessions, Bounce Rate, etc.).
- Overall Sessions.
- Top Traffic Channels by Sessions.
- Traffic Sources/Medium.
- New vs. Returning Customers.
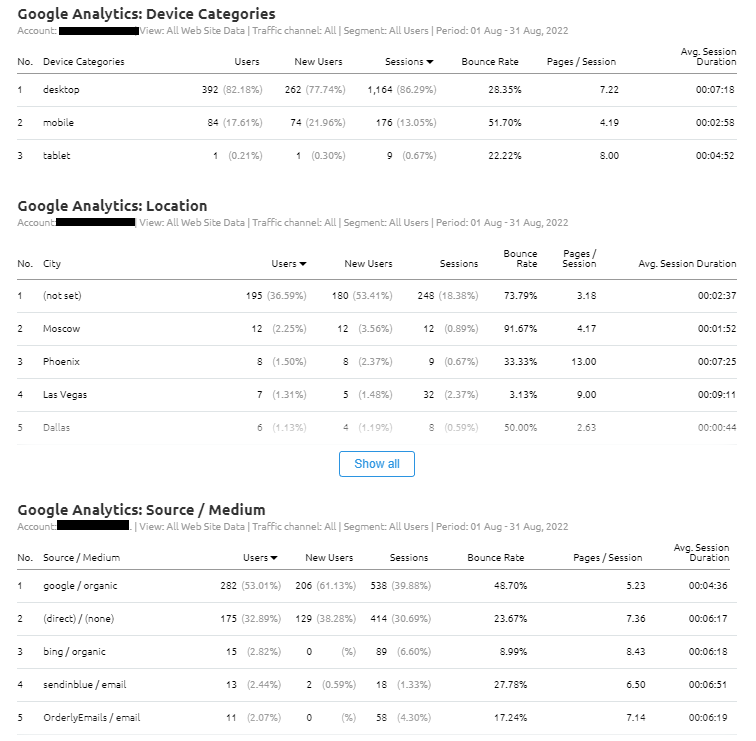 Screenshot from Google Analytics, September 2022
These metrics tell our clients which campaigns yield the most significant traffic flow and from which cities and sources.
I also like to include Google Search Console data in my reports for tracking SERP (search engine results page) data, such as clicks, impressions, and CTR (click-through rate).
You’ll also need a tool to report keyword data, such as Semrush or Ahrefs. Semrush even provides a neat tool to construct reports easily and build templates for future clients.
3. Segment Keywords By Location
Getting into some more of the local aspects of SEO, we’ll need to ensure that our reports are adequately optimized to only report on local keyword data.
For this section, you’ll need an advanced keyword tool like Semrush, Moz, or Ahrefs.
I used Semrush to create a new project and implement position tracking on my most strategic keywords in this example.
As you can see below, I set up position tracking for searches specifically in the Houston metropolitan area. I then can upload keywords I am tracking from Semrush or even Google Analytics to report on.
To filter the keywords I am tracking, I can also add tags that separate them into specific categories.
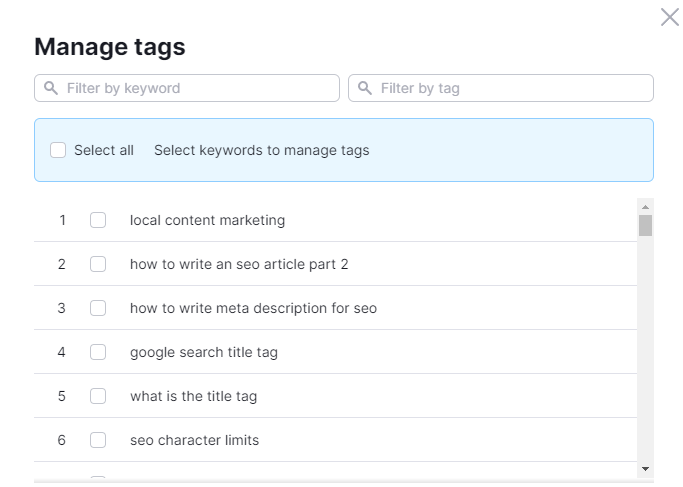 Screenshot from Semrush, September 2022
You can get as granular as you wish with your list by separating your keywords by question phrases, “near me” searches, or including a city-based keyword from your list.
Once you have position tracking and tags set up, you can easily export or add those keywords to a CSV or Semrush’s reporting tool.
4. Segment Traffic By Device
Equally crucial for tracking local SEO campaigns is filtering data by device.
That’s why I like to include sections in my reports outlining traffic by device and even going as granular as by location and device.
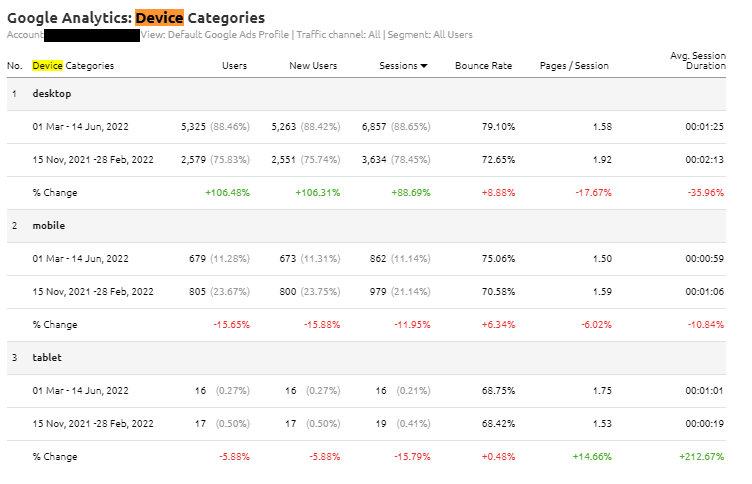 Screenshot from Google Analytics, September 2022
Regarding local SEO, mobile search traffic is arguably more important than desktop traffic, especially when you factor in click-to-calls and mobile ordering, which are commonly done on a smartphone or other mobile device.
5. Track Local SERP Results
Another massive difference in how Google approaches local searches is using tools like the Local Search Pack and Google Business Profile.
For several local businesses, Google Business Profile listings can be a significantly higher source of conversions and foot traffic to a business than their actual website.
You’ll need to sign up for a connector to track Google Business Profile data using any conventional reporting tool.
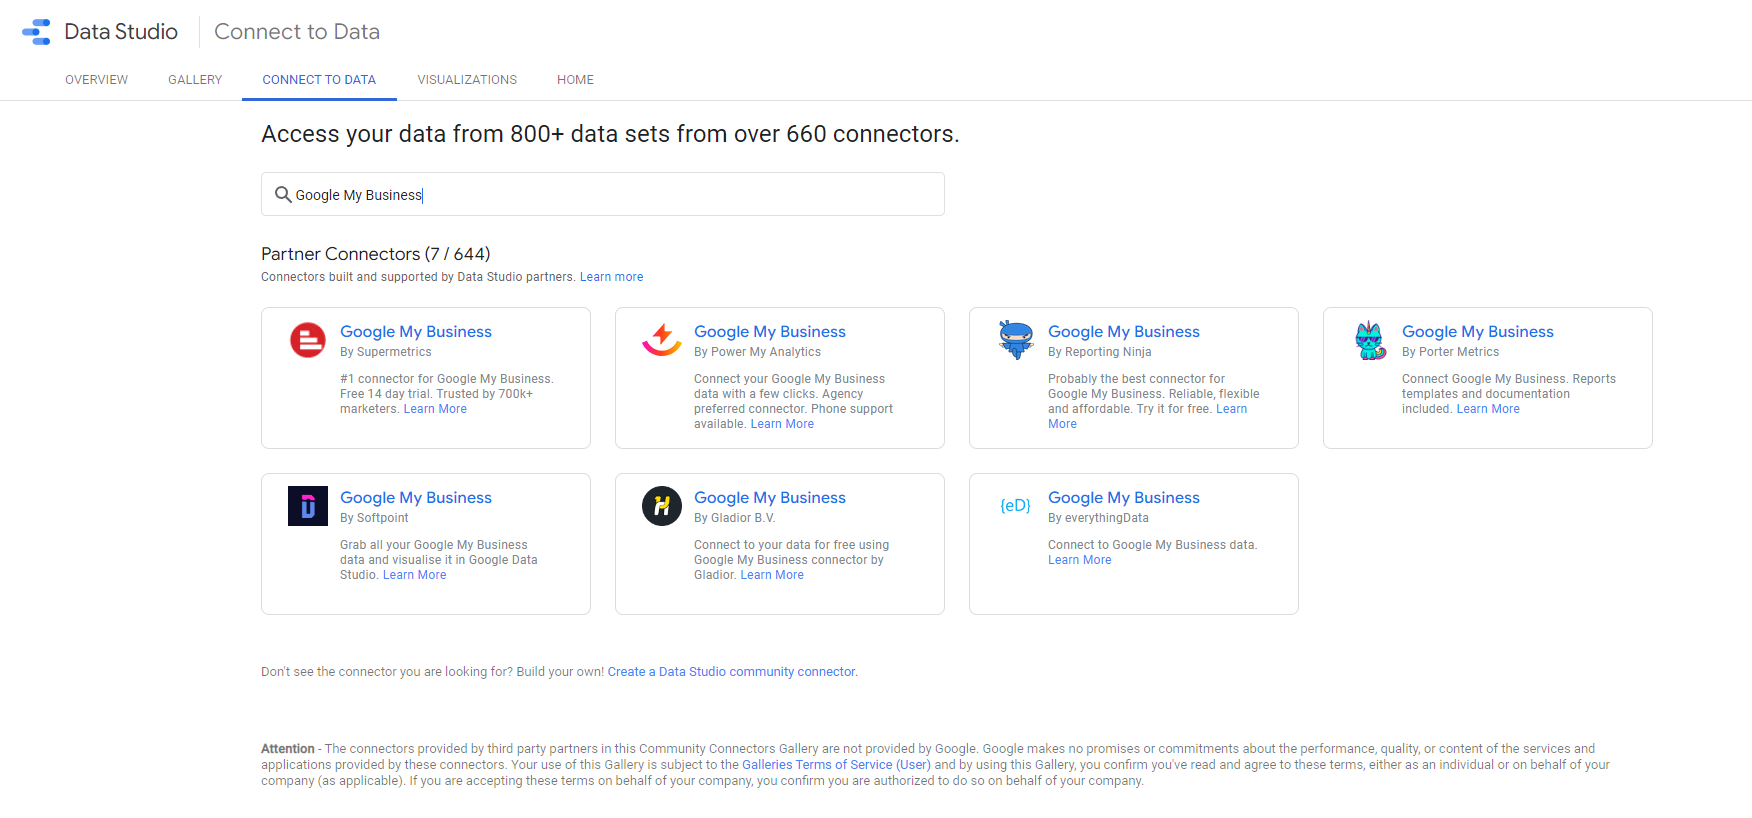 Screenshot from Google Data Studio, September 2022
However, many keyword tools like Semrush offer detailed keyword information about local search results, such as local pack results and featured snippets.
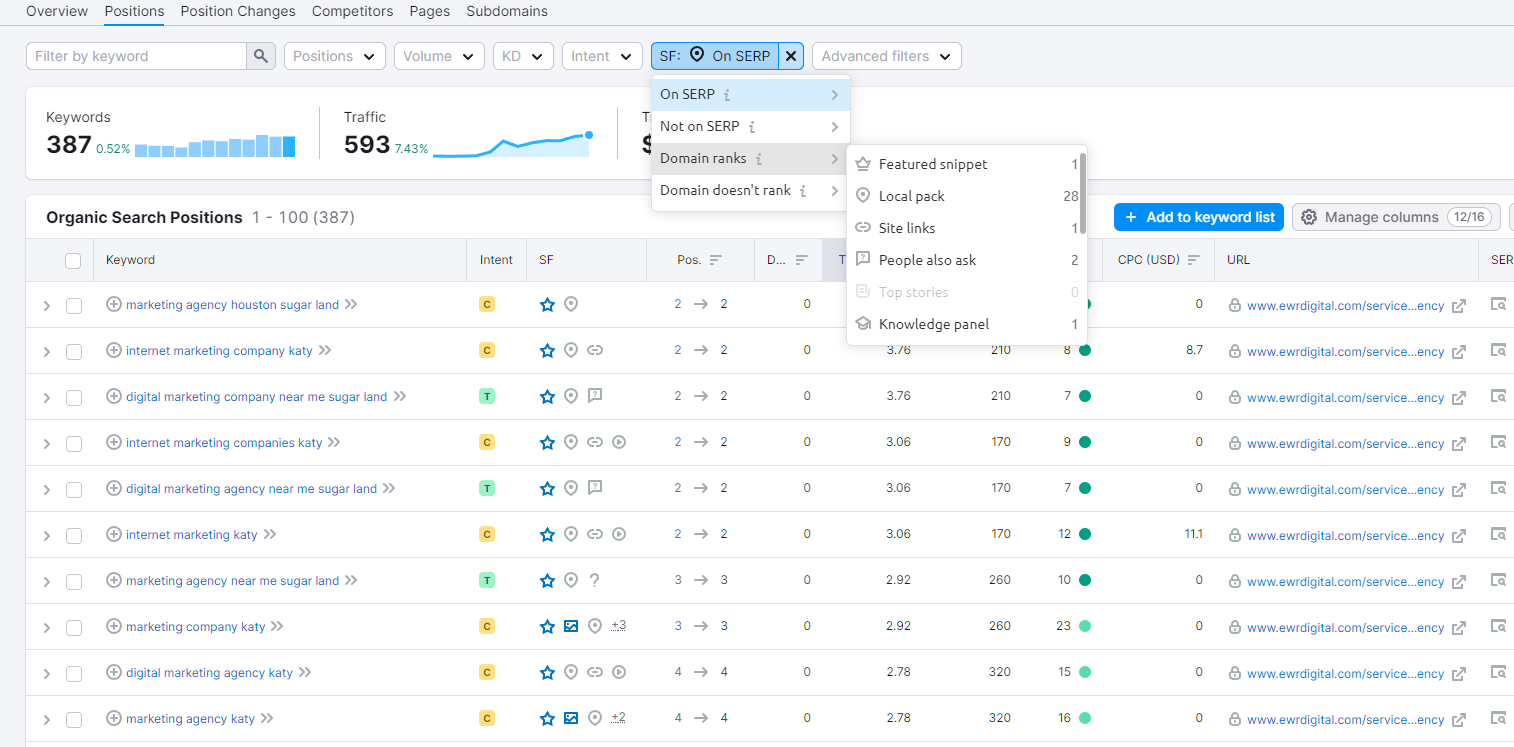 Screenshot from Semrush, September 2022
This information is highly relevant to businesses looking to rank in “near me” searches that generate a lot of traffic to their business.
Export this data to a CSV or upload it directly into Semrush’s reporting tool.
6. Go Beyond Standard SEO Tools And Metrics
Going beyond the local pack, we can add several additional KPIs (key performance indicators) to our local SEO reports that are highly relevant to businesses.
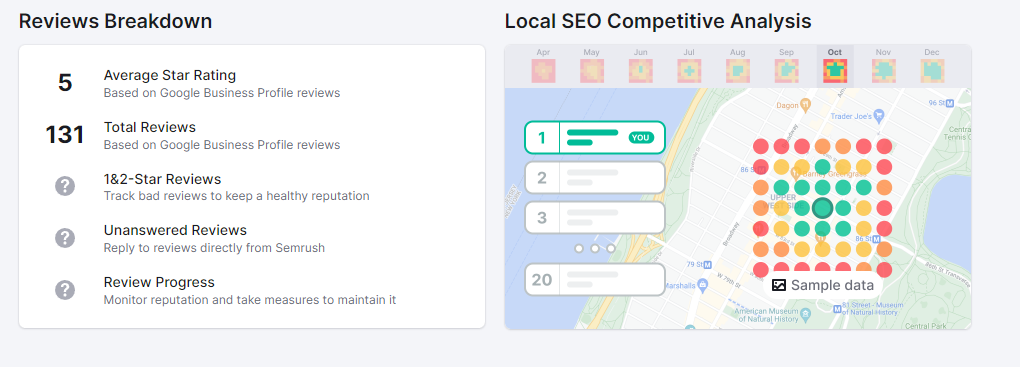 Screenshot from Semrush, September 2022
For example, consider including the following metrics in your next local SEO report:
- Reviews.
- Unlinked brand mentions.
- Backlinks (if relevant to your campaign).
- Social media engagement.
You might need to purchase a social listening tool or upgrade your Semrush account to track social media mentions and engagement.
However, you can also do manual research to monitor changes in review ratings, unlinked brand mentions, or social media engagement on trending posts to add to your reports.
7. Provide Actionable Information
Finally, we want to wrap up our reports by adding a section at the end summarizing campaign results and future actions based on the data you present.
This section will help you complete your story using the data provided and help clients understand what you presented to them.
I also find adding a final section for recommendations important because many campaigns can be hampered by low budgets or reluctant clients who don’t want to take all the necessary steps to change their site.
So if your campaign is bogged down because a local business won’t update its site or implement recommended changes, be sure to remind them nicely at the end of your report and explain the benefits of your recommendations.
More resources:
Featured Image: Andrey_Popov/Shutterstock
window.addEventListener( ‘load’, function() {
setTimeout(function(){ striggerEvent( ‘load2’ ); }, 2000);
});
window.addEventListener( ‘load2’, function() {
if( sopp != ‘yes’ && addtl_consent != ‘1~’ && !ss_u ){
!function(f,b,e,v,n,t,s)
{if(f.fbq)return;n=f.fbq=function(){n.callMethod?
n.callMethod.apply(n,arguments):n.queue.push(arguments)};
if(!f._fbq)f._fbq=n;n.push=n;n.loaded=!0;n.version=’2.0′;
n.queue=[];t=b.createElement(e);t.async=!0;
t.src=v;s=b.getElementsByTagName(e)[0];
s.parentNode.insertBefore(t,s)}(window,document,’script’,
‘https://connect.facebook.net/en_US/fbevents.js’);
if( typeof sopp !== “undefined” && sopp === ‘yes’ ){
fbq(‘dataProcessingOptions’, [‘LDU’], 1, 1000);
}else{
fbq(‘dataProcessingOptions’, []);
}
fbq(‘init’, ‘1321385257908563’);
fbq(‘track’, ‘PageView’);
fbq(‘trackSingle’, ‘1321385257908563’, ‘ViewContent’, {
content_name: ‘local-seo-reporting’,
content_category: ‘local-search seo’
});
}
});

![The Death & Afterlife of Content Marketing [Podcast] 53 sejshow featured image ep287 633edbe339e15 sej](https://www.thetimesclock.com/wp-content/uploads/2022/10/sejshow-featured-image-ep287-633edbe339e15-sej-150x150.jpg)
