We all know that customers interact with a brand through multiple channels and campaigns (online and offline) along their path to conversion.
Surprisingly, within the B2B sector, the average customer is exposed to a brand 36 times before converting into a customer.
With so many touchpoints, it is difficult to really pin down just how much a marketing channel or campaign influenced the decision to buy.
This is where marketing attribution comes in.
Marketing attribution provides insights into the most effective touchpoints along the buyer journey.
In this comprehensive guide, we simplify everything you need to know to get started with marketing attribution models, including an overview of your options and how to use them.
What Is Marketing Attribution?
Marketing attribution is the rule (or set of rules) that says how the credit for a conversion is distributed across a buyer’s journey.
How much credit each touchpoint should get is one of the more complicated marketing topics, which is why so many different types of attribution models are used today.
6 Common Attribution Models
There are six common attribution models, and each distributes conversion value across the buyer’s journey differently.
Don’t worry. We will help you understand all of the models below so you can decide which is best for your needs.
Note: The examples in this guide use Google Analytics 4 cross-channel rules-based models.
Cross-channel rules-based means that it ignores direct traffic. This may not be the case if you use alternative analytics software.
1. Last Click
The last click attribution model gives all the credit to the marketing touchpoint that happens directly before conversion.
Last Click helps you understand which marketing efforts close sales.
For example, a user initially discovers your brand by watching a YouTube Ad for 30 seconds (engaged view).
Later that day, the same user Googles your brand and clicks through an organic search result.
The following week this user is shown a retargeting ad on Facebook, clicks through, and signs up for your email newsletter.
The next day, they click through the email and convert to a customer.
Under a last-click attribution model, 100% of the credit for that conversion is given to email, the touchpoint that closed the sale.
2. First Click
The first click is the opposite of the last click attribution model.
All of the credit for any conversion that may happen is awarded to the first interaction.
The first click helps you to understand which channels create brand awareness.
It doesn’t matter if the customer clicked through a retargeting ad and later converted through an email visit.
If the customer initially interacted with your brand through an engaged YouTube view, Paid Video gets full credit for that conversion because it started the journey.
3. Linear
Linear attribution provides a look at your marketing strategy as a whole.
This model is especially useful if you need to maintain awareness throughout the entire buyer journey.
Credit for conversion is split evenly among all the channels a customer interacts with.
Let’s look at our example: Each of the four touchpoints (Paid Video, Organic, Paid Social, and Email) all get 25% of the conversion value because they’re all given equal credit.
4. Time Decay
Time Decay is useful for short sales cycles like a promotion because it considers when each touchpoint occurred.
The first touch gets the least amount of credit, while the last click gets the most.
Using our example:
- Paid Video (YouTube engaged view) would get 10% of the credit.
- Organic search would get 20%.
- Paid Social (Facebook ad) gets 30%.
- Email, which occurred the day of the conversion, gets 40%.
Note: Google Analytics 4 distributes this credit using a seven-day half-life.
5. Position-Based
The position-based (U-shaped) approach divides credit for a sale between the two most critical interactions: how a client discovered your brand and the interaction that generated a conversion.
With position-based attribution modeling, Paid Video (YouTube engaged view) and Email would each get 40% of the credit because they were the first and last interaction within our example.
Organic search and the Facebook Ad would each get 10%.
6. Data-Driven (Cross-Channel Linear)
Google Analytics 4 has a unique data-driven attribution model that uses machine learning algorithms.
Credit is assigned based on how each touchpoint changes the estimated conversion probability.
It uses each advertiser’s data to calculate the actual contribution an interaction had for every conversion event.
Best Marketing Attribution Model
There isn’t necessarily a “best” marketing attribution model, and there’s no reason to limit yourself to just one.
Comparing performance under different attribution models will help you to understand the importance of multiple touchpoints along your buyer journey.
Model Comparison In Google Analytics 4 (GA4)
If you want to see how performance changes by attribution model, you can do that easily with GA4.
To access model comparison in Google Analytics 4, click “Advertising” in the left-hand menu and then click “Model comparison” under “Attribution.”

By default, the conversion events will be all, the date range will be the last 28 days, and the dimension will be the default channel grouping.
Start by selecting the date range and conversion event you want to analyze.
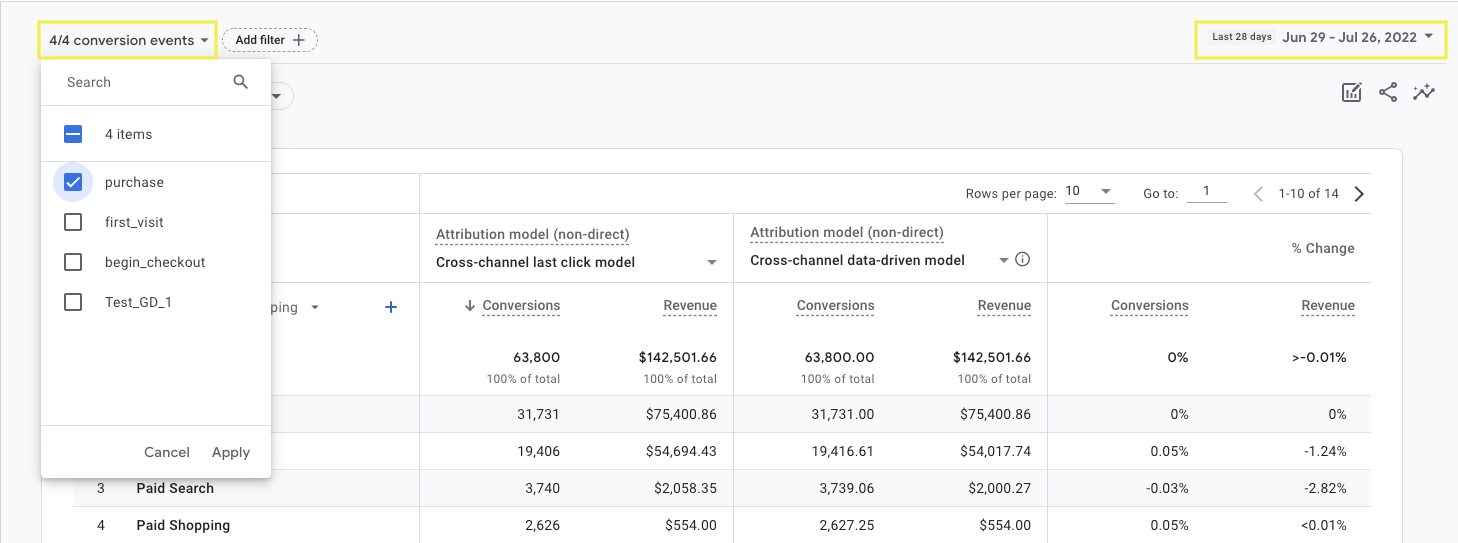 Screenshot from GA4, July 2022
You can add a filter to view a specific campaign, geographic location, or device using the edit comparison option in the top right of the report.
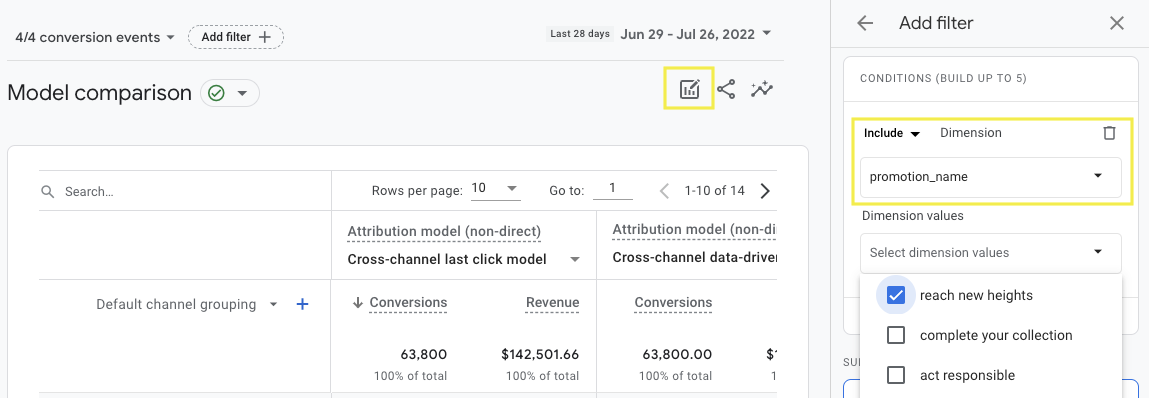 Screenshot from GA4, July 2022
Select the dimension to report on and then use the drown-down menus to select the attribution models to compare.
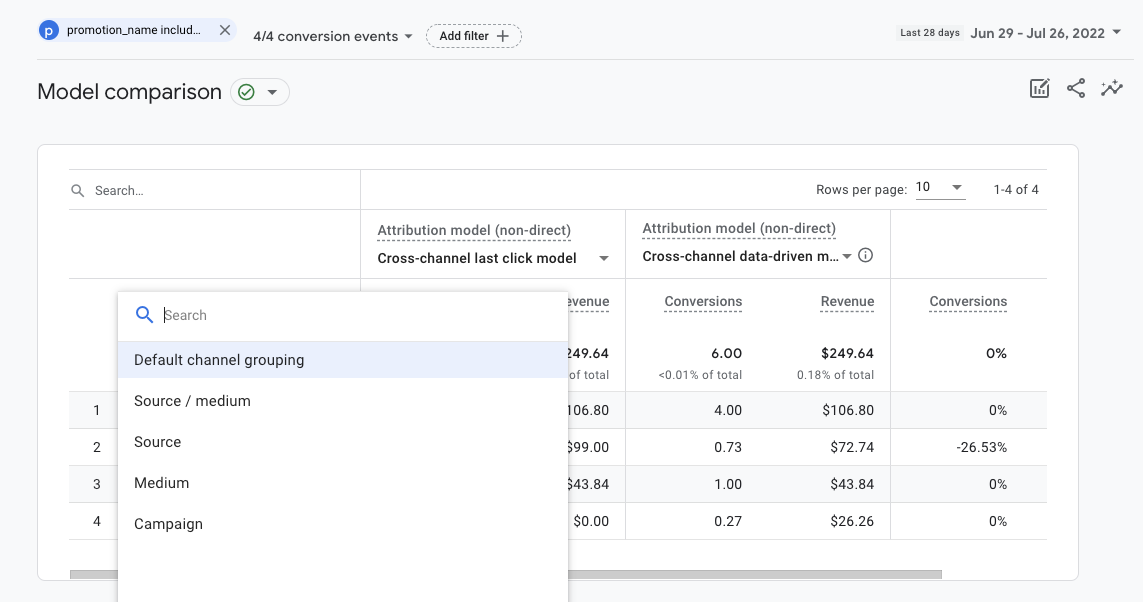 Screenshot from GA4, July 2022
GA4 Model Comparison Example
Let’s say you’re asked to increase new customers to the website.
You could open Google Analytics 4 and compare the “last-click” model to the “first-click” model to discover which marketing efforts start customers down the path to conversion.
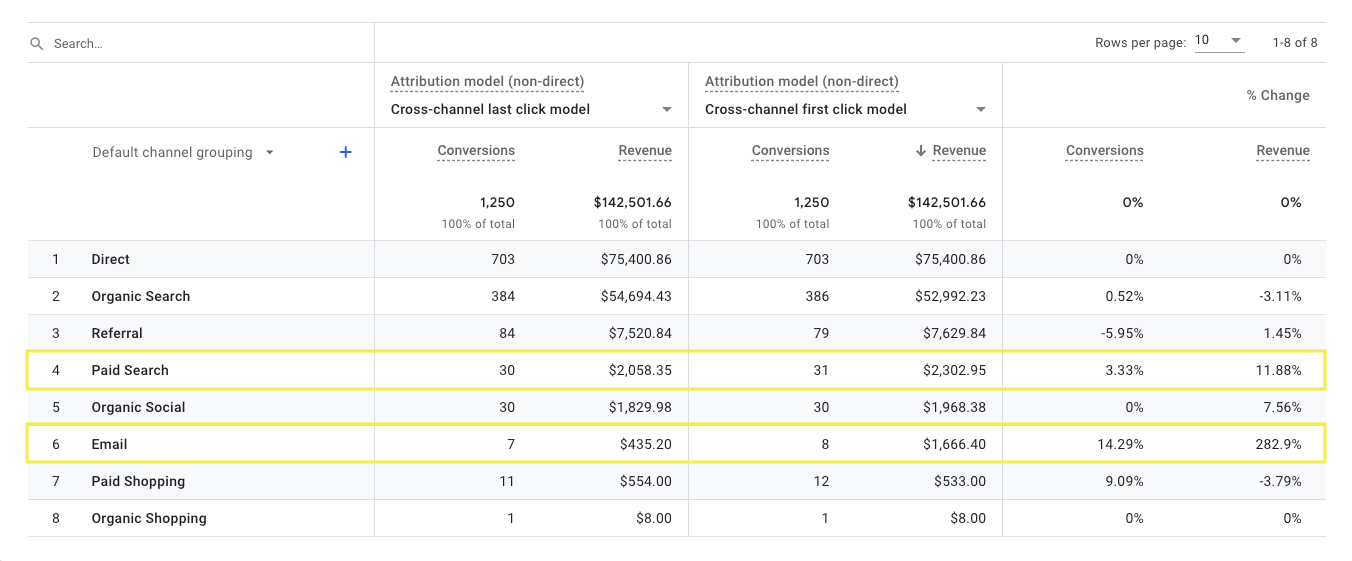 Screenshot from GA4, July 2022
In the example above, we may choose to look further into the email and paid search further because they appear to be more effective at starting customers down the path to conversion than closing the sale.
How To Change Google Analytics 4 Attribution Model
If you choose a different attribution model for your company, you can edit your attribution settings by clicking the gear icon in the bottom left-hand corner.
Open Attribution Settings under the property column and click the Reporting attribution model drop-down menu.
Here you can choose from the six cross-channel attribution models discussed above or the “ads-preferred last click model.”
Ads-preferred gives full credit to the last Google Ads click along the conversion path.
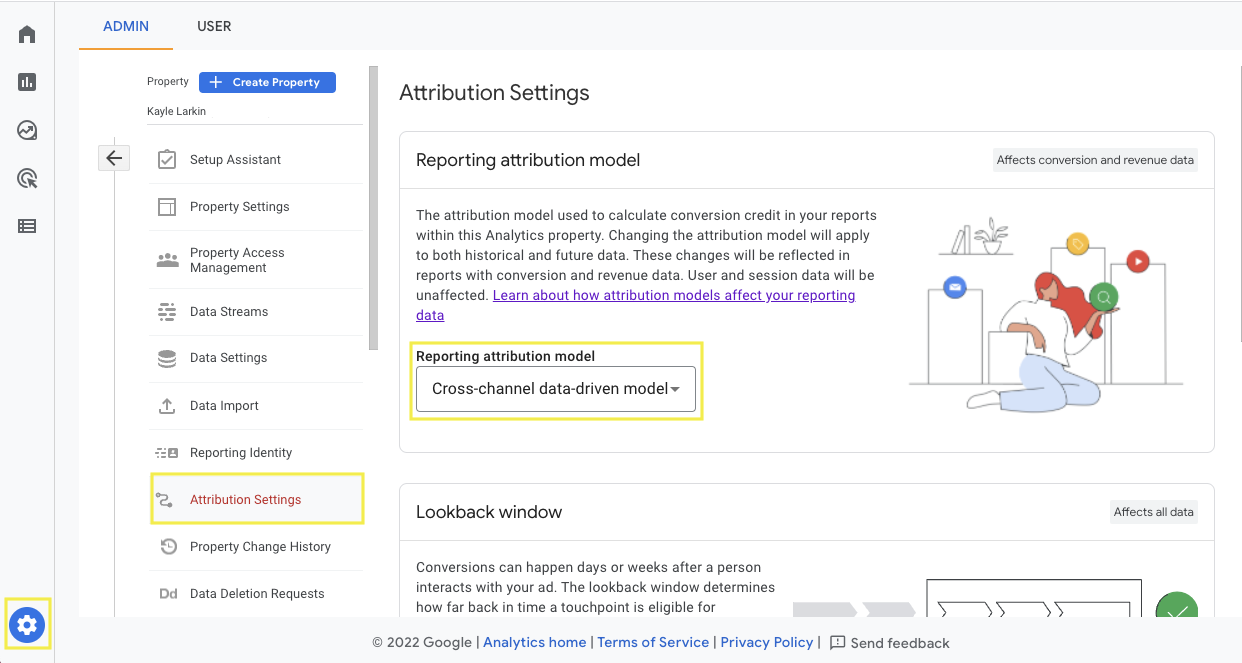 Screenshot from GA4, July 2022
Please note that attribution model changes will apply to historical and future data.
Final Thoughts
Determining where and when a lead or purchase occurred is easy. The hard part is defining the reason behind a lead or purchase.
Comparing attribution modeling reports help us to understand how the entire buyer journey supported the conversion.
Looking at this information in greater depth enables marketers to maximize ROI.
Got questions? Let us know on Twitter or Linkedin.
More Resources:
Featured Image: Andrii Yalanskyi/Shutterstock
window.addEventListener( ‘load’, function() {
setTimeout(function(){ striggerEvent( ‘load2’ ); }, 2000);
});
window.addEventListener( ‘load2’, function() {
if( sopp != ‘yes’ && addtl_consent != ‘1~’ && !ss_u ){
!function(f,b,e,v,n,t,s)
{if(f.fbq)return;n=f.fbq=function(){n.callMethod?
n.callMethod.apply(n,arguments):n.queue.push(arguments)};
if(!f._fbq)f._fbq=n;n.push=n;n.loaded=!0;n.version=’2.0′;
n.queue=[];t=b.createElement(e);t.async=!0;
t.src=v;s=b.getElementsByTagName(e)[0];
s.parentNode.insertBefore(t,s)}(window,document,’script’,
‘https://connect.facebook.net/en_US/fbevents.js’);
if( typeof sopp !== “undefined” && sopp === ‘yes’ ){
fbq(‘dataProcessingOptions’, [‘LDU’], 1, 1000);
}else{
fbq(‘dataProcessingOptions’, []);
}
fbq(‘init’, ‘1321385257908563’);
fbq(‘track’, ‘PageView’);
fbq(‘trackSingle’, ‘1321385257908563’, ‘ViewContent’, {
content_name: ‘marketing-attribution-models-guide’,
content_category: ‘marketing-analytics pay-per-click’
});
}
});
Source
[sibwp_form id=1]


